Performance Analysis of Hitachi USP
I am strong believer in bringing everything in life to a one page view. Whether it is logical view into a application or a architecture picture of a complex system. I use this philosophy into any performance work I do also.
My favorites are a “Heat Chart” view of a storage array showing the resource utilization at every component level. These utilizations can be shown at the peak level irrespective of the time frame it occurred, showing 95 percentile utilization irrespective of the time frame or just showing the peak point in time view into the storage array.
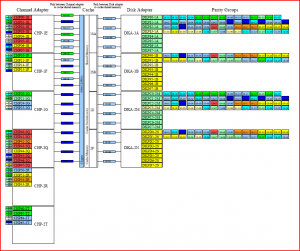
With that in mind we have recently created a “Heat Chart” view of the Hitachi USP with our copyrighted view into the Hitachi array. The storage performance resource utilizations are shown based on the metrics from the Tuning Manager for each of the components.
The Performance utilization heat chart provides a very elegant way to gets birds eye view into all critical components of the storage array. The Perfonics™ tool set allows us to do this easily and with various options to zoom into time frames or 95th percentiles to make better technical decisions.
This view shows the following components all at one time:
– Front-end Fibre Ports
– Front-end Channel Processors and Adapters
– Path between Channel Adapters to cache shared memory
– Cache
– Path between Disk Adapters to cache shared memory
– Disk Adapters
– Disk Processors
– RAID Groups and their utilizations
– Physical Disk utilization
If you are looking for elegant performance analysis solutions, this is worth a try. More information can be found at http://www.interscape.io
Coming soon, SaaS based access to your performance views and much more….

