Performance Analysis of EMC Symmetrix DMX
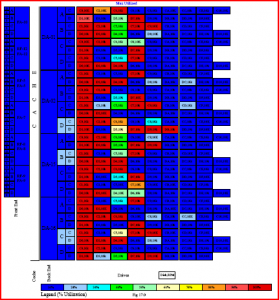
Continuing the discussion on doing performance analysis with simple one page views, here is a sample of what can be done with an EMC Symmetrix DMX. This views is based on the performance data that is collected by EMC Control Center (ECC) with Performance Manager (WorkLoad Analyzer – WLA) tool. The performance utilizations are based on threshold values and shown on top of the EMC Symmetrix DMX Configuration. All major critical components of the DMX are shown with color legend shown on the bottom. The view shows the following component utilizations:
– Front-end Fibre Ports
– Front-end Fibre Processors and Fibre Directors
– Cache
– Disk Directors, Processors, Ports
– Physical Disks, Disk Speed (RPM)
Above is the chart showing the heat chart of a processed Hitachi USB data.
More information on how to create these views at http://www.interscape.io

